Abstract
Purpose
Ultrasound-driven microbubbles (USMB) have synergistic effects with radiotherapy (RT). Sequencing of RT and vascular-disrupting agents can influence cytotoxicity. We investigated outcomes based on USMB and RT sequencing in a preclinical prostate cancer model.
Methods
PC-3 prostate cancer xenografts were treated with ultrasound-driven lipid microspheres and 8 Gy of external-beam RT. Sequence 1 (S1) consisted of USMB treatment preceding RT by 3, 6, 12, and 24 hours; Sequence 2 (S2) gave USMB after RT at the same times. 5 tumors were treated at baseline (no treatment) and at each time point. Effects were tested via staining for CD31, TUNEL and H&E, and Carbonic Anhydrase 9 (CA9) to measure microvessel density (MVD), cell death (CD) and hypoxia, respectively.
Results
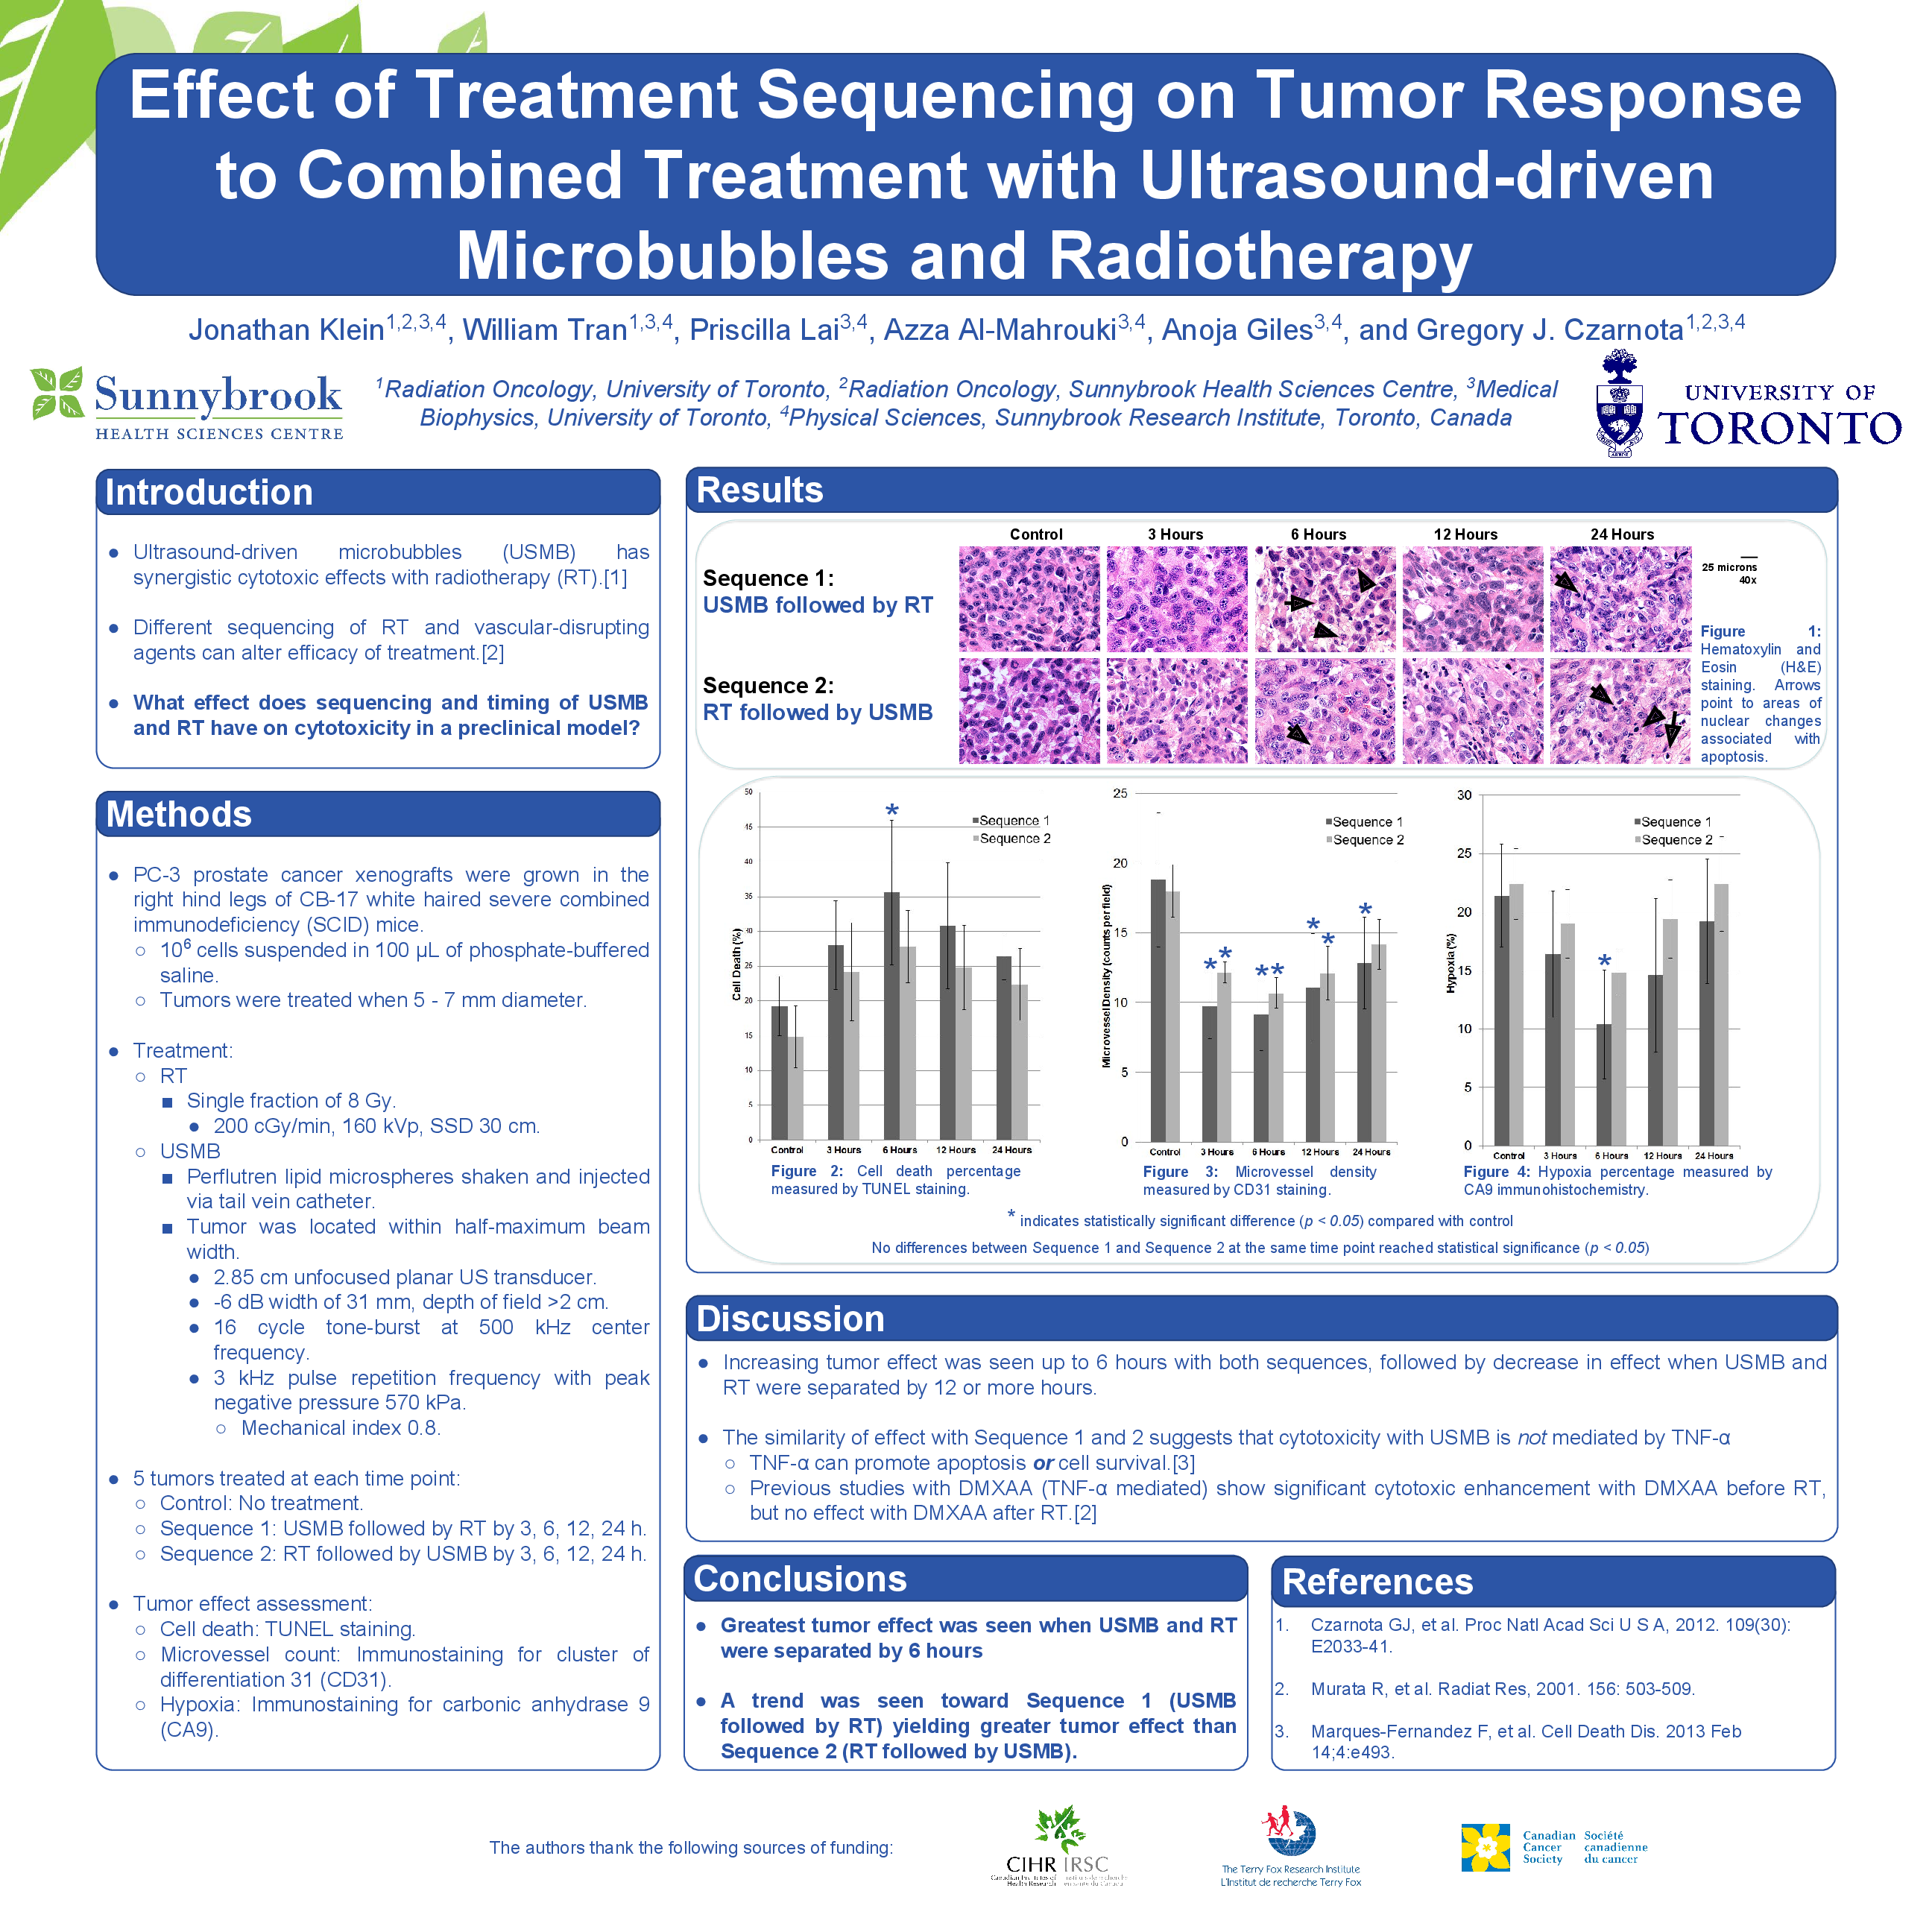
Using S1, MVD was 18.8 ± 4.8 counts per field (cpf) at baseline and 9.8 ± 2.3, 9.1 ± 2.5, 11.0 ± 3.9 and 12.8 ± 3.3 cpf when USMB preceded RT by 3, 6, 12 and 24 hours, respectively. Using S2, MVD was 18.0 ± 1.8 cpf at baseline and 12.2 ± 0.7, 10.7 ± 1.1, 12.1 ± 1.9 and 14.2 ± 1.8 cpf, respectively, when RT preceded USMB by the same times. Each MVD measurement was significantly lower than control (p<0.05) except for S2 separated by 24 hours (S2-24). The MVD using S1 was larger than S2 at all time points, but none of these differences were statistically significant. Percent CD using S1 was 19.2% ± 4.4% at baseline and 28.0% ± 6.4%, 35.6% ± 10.4%, 30.8% ± 9.0% and 26.4% ± 3.4% when USMB preceded RT by 3, 6, 12 and 24 hours, respectively. Using S2, CD was 14.8% ± 4.4% at baseline and 24.2% ± 7.0%, 27.8% ± 5.2%, 24.8% ± 6.1% and 22.4% ± 5.2%, respectively, at the same times. Only the S1-6 measurement differed significantly from baseline (p<0.01). There was more cell death with S1 than S2 at all time points but these differences were not statistically significant (p>0.05).
By both MVD and CD, maximum effect occurred using S1-6. Among S2 measurements, maximum effect was using S2-6. However, despite the clear trend of increasing effect with longer separation time up to 6 hours followed by a decrease with longer separation, the measurements at 3, 6, 12 and 24 hours were not significantly different from each other using either S1 or S2 (p>0.05). The only hypoxia measurement significantly different from baseline was S1-6 (p<0.01). The lowest S2 measurement was S2-6, but it did not differ significantly from baseline (p>0.05). Less hypoxia was measured using S1 than S2 at all time points but these differences were not statistically significant (p>0.05).
Conclusion
Maximum tumor effect was seen with treatment separation of 6 hours and a trend was identified toward S1 yielding greater tumor effect than S2. Testing of a larger sample should confirm this finding after which further testing is warranted to develop clinical protocols combining USMB and RT.