Spectral EEG Indicators of the Kinetics of the Hypothetical Processes S and Wduring prolonged wakefulness and wake-sleep transitions
Abstract
Objectives. The cyclic transitions between wakefulness and sleep might be ultimately delineated as oscillations between opposing neurobiological processes, i.e., those promoting arousal and inhibiting sleep and those promoting sleep and inhibiting arousal.
The major aim of the present analysis was to uncover the electroencephalographic (EEG) indicators of the hypothetical opponent processes underlying the wake-sleep transitions.
Methods. Data included 315 EEG recordings of the attempts of 15 study participants to stay permanently awake for 43-61-h periods, and 356 EEG recordings of the successful napping attempts of 32 participants. Principal component analysis was performed on the sets of 16 single-Hz log-transformed EEG powers (frequency range from 1 Hz – 16 Hz).
Results. A close resemblance was demonstrated between the patterns of changes in the EEG indexes during prolonged wakefulness and across transitions between wakefulness and sleep.
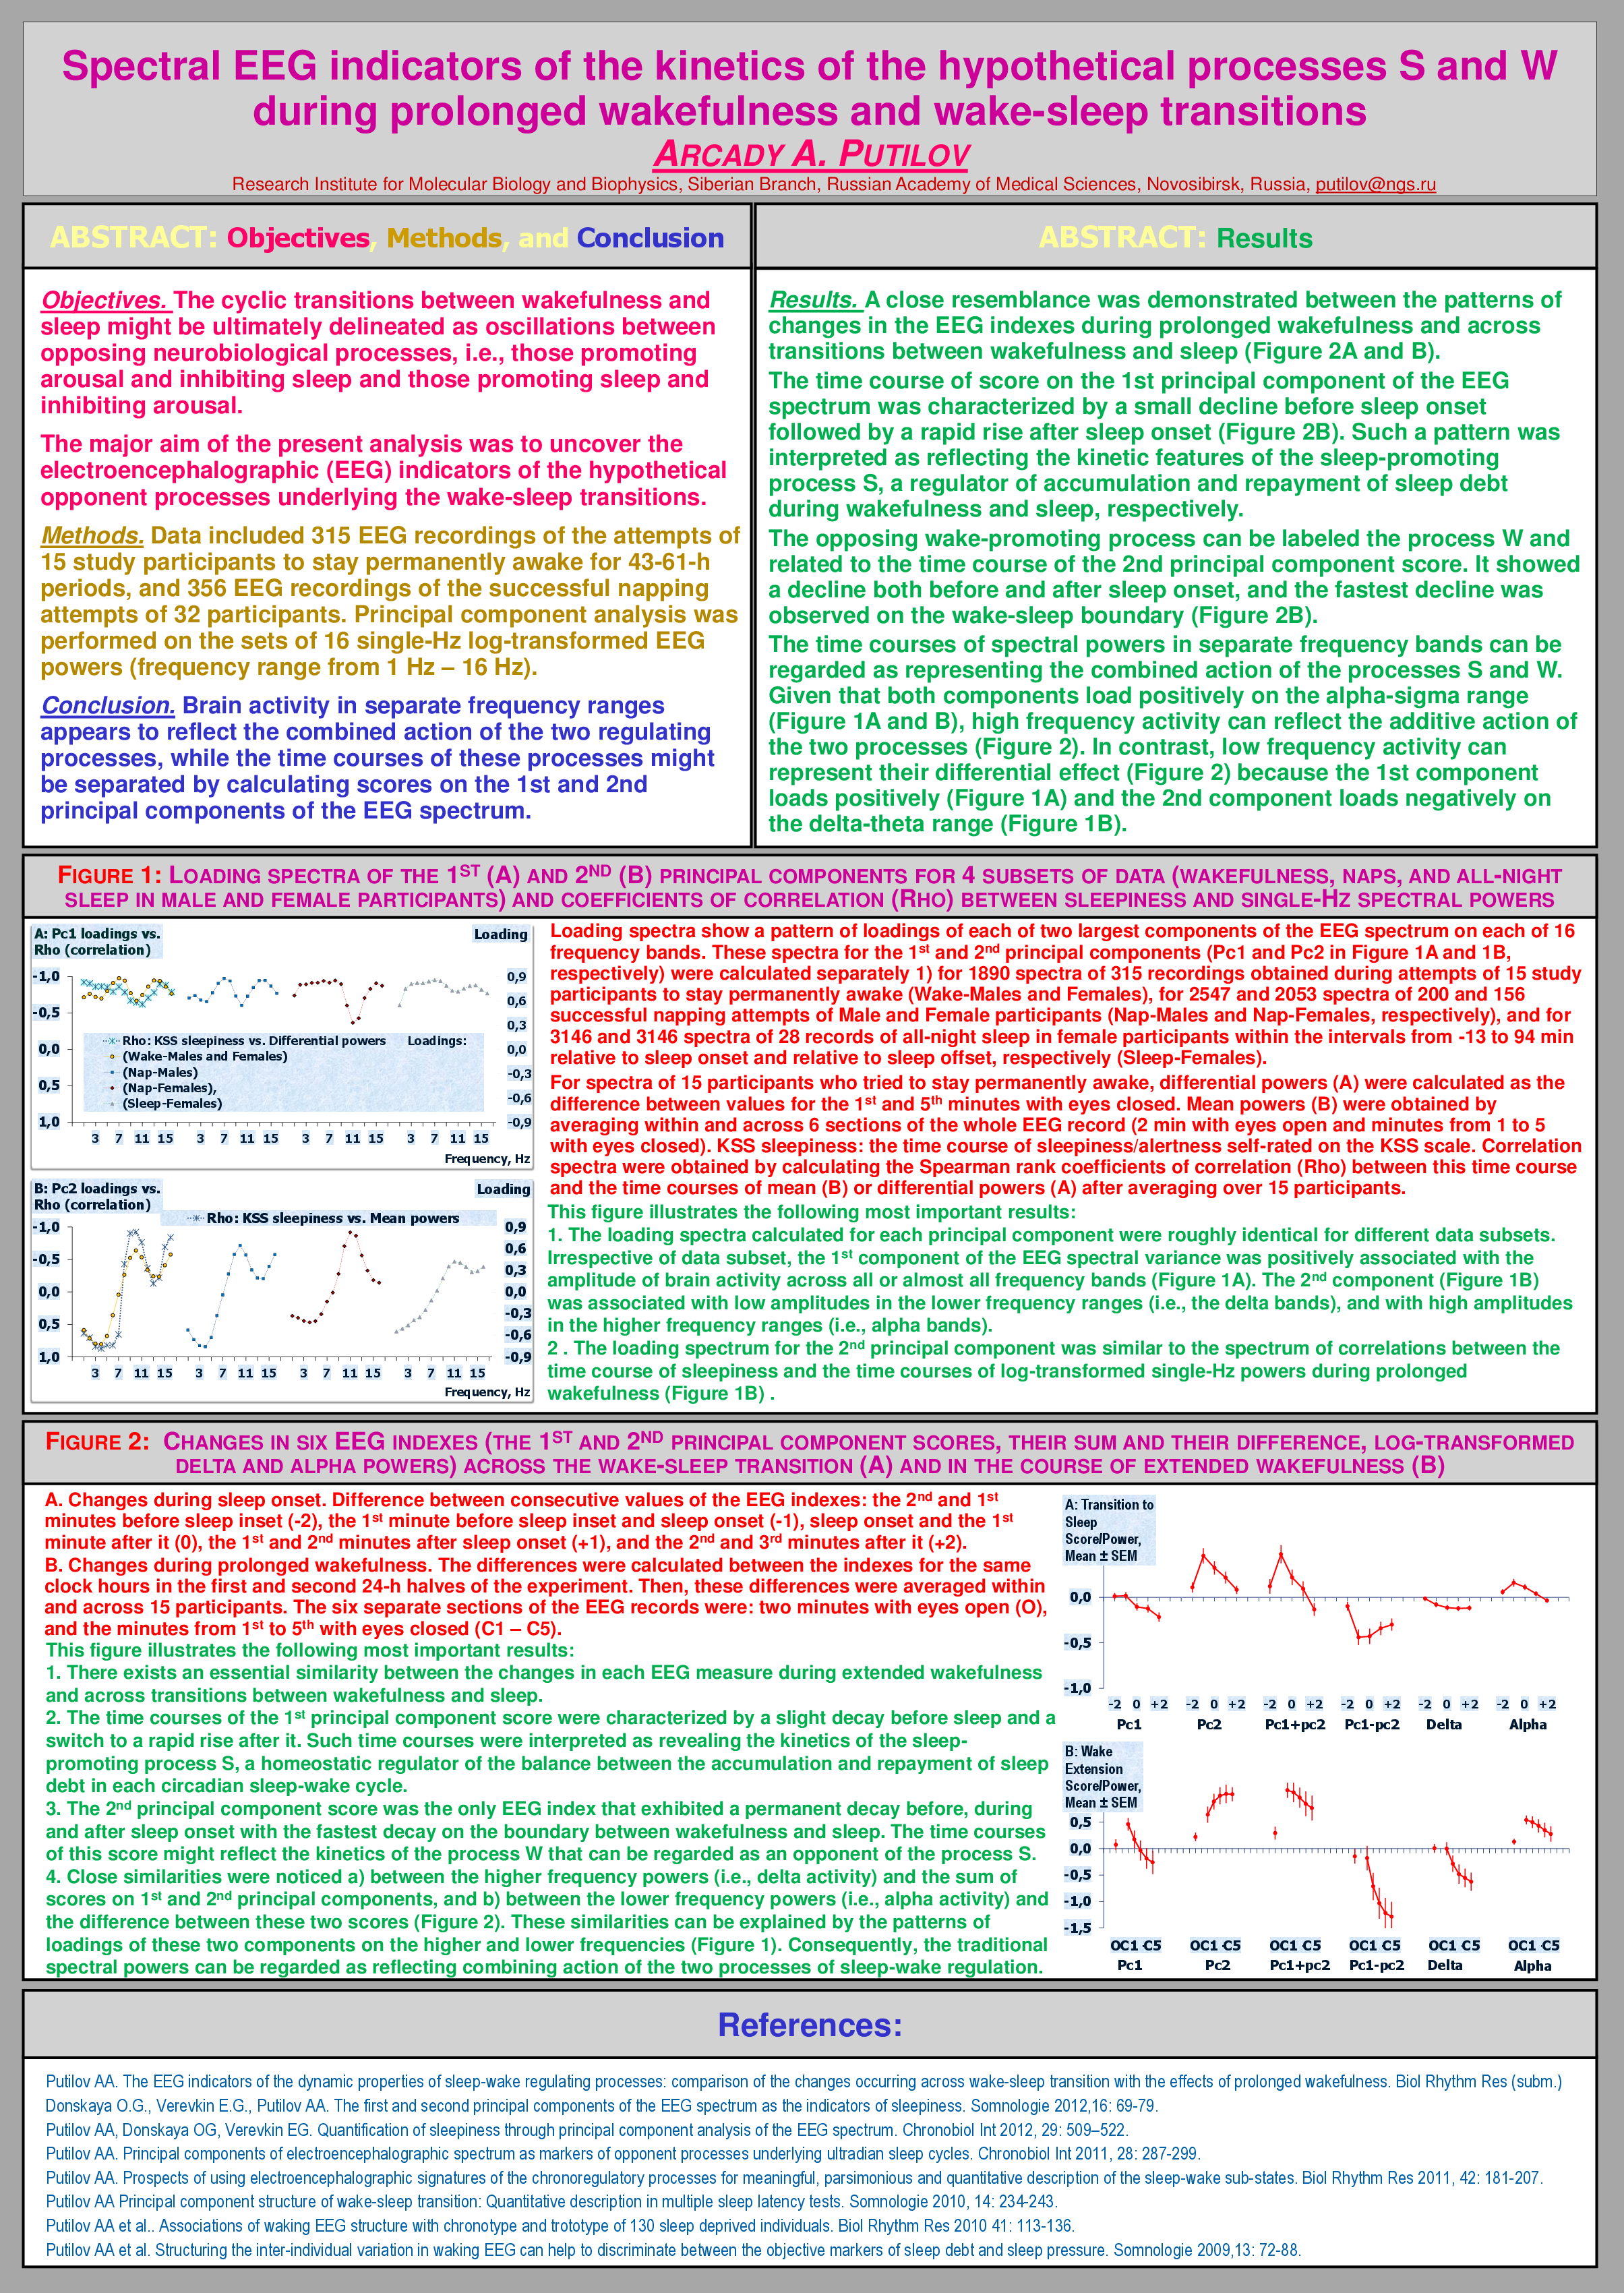
The time course of score on the 1st principal component of the EEG spectrum was characterized by a small decline before sleep onset followed by a rapid rise after sleep onset. Such a pattern was interpreted as reflecting the kinetic features of the sleep-promoting process S, a regulator of accumulation and repayment of sleep debt during wakefulness and sleep, respectively.
The opposing wake-promoting process can be labeled the process W and related to the time course of the 2nd principal component score. It showed a decline both before and after sleep onset, and the fastest decline was observed on the wake-sleep boundary.
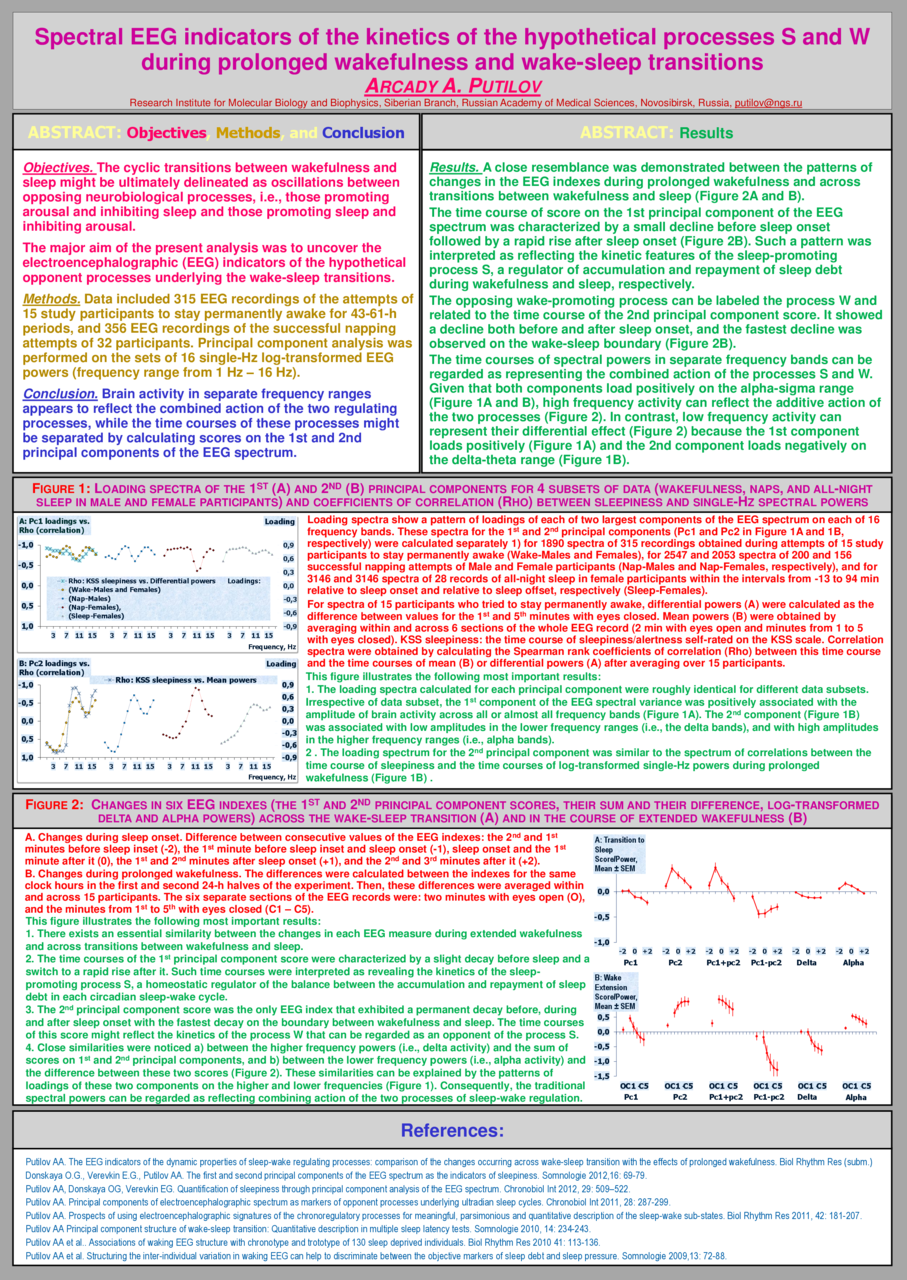
The time courses of spectral powers in separate frequency bands can be regarded as representing the combined action of the processes S and W. Given that both components load positively on the alpha-sigma range, high frequency activity can reflect the additive action of the two processes. In contrast, low frequency activity can represent their differential effect because the 1st component loads positively and the 2nd component loads negatively on the delta-theta range.
Conclusion. Brain activity in separate frequency ranges appears to reflect the combined action of the two regulating processes, while the time courses of these processes might be separated by calculating scores on the 1st and 2nd principal components of the EEG spectrum.
Related articles